

The villa journal
A Rainy Day Does Not Tell You How Long It Rained
Rainfall totals and rainy day counts measure different things. Learn how to read Hua Hin’s historical climate figures before using them to plan a visit.
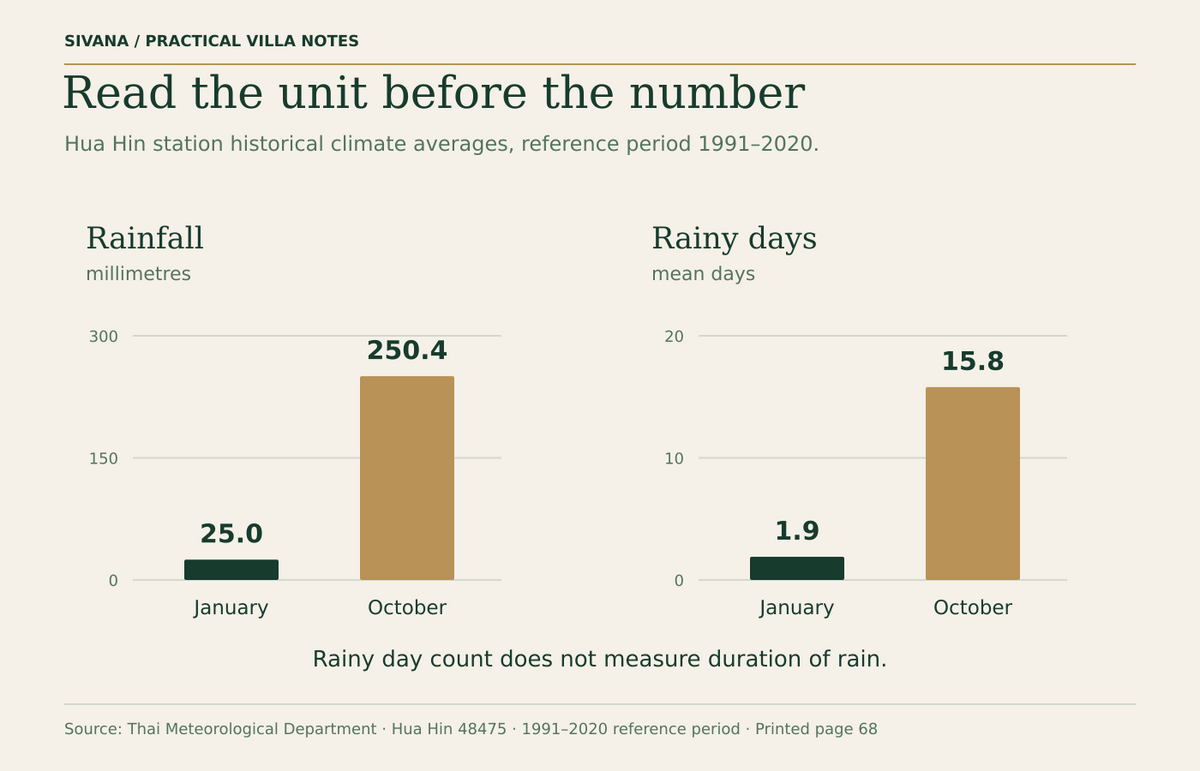
A climate table can say that a month has a certain number of rainy days without saying whether rain lasted a few minutes or many hours on those days. That distinction matters when you are imagining outdoor meals, a viewing trip or several months in Hua Hin.
The Thai Meteorological Department publication used in Hua Hin Through the Year defines a rainy day as one with at least 0.1 millimetres of rain. The measurement day runs from 07:00 to 07:00 local time. The count tells you how many observation days met that threshold; it does not measure the duration of rain.
Read the units before comparing the numbers
The Hua Hin station table for the 1991–2020 reference period gives January mean rainfall of 25.0 millimetres and 1.9 mean rainy days. October is listed at 250.4 millimetres and 15.8 mean rainy days. These are different measurements of the historical record, and each needs its own label.
The decimal in a rainy day average is not a fraction of a particular forecast day. It results from averaging observations over the underlying record. A month in an individual year can differ from the published average.
Ask which question each measure can answer
A rainfall total helps you compare recorded amounts over the relevant period. A rainy day count helps you compare how often the threshold was reached. Neither field, on its own, tells you which hours were wet, how much rain fell at a particular villa or whether a specific road was affected.
If someone turns “rainy days” into “days you cannot go outside,” the conclusion goes beyond the measurement. Equally, a low average should not be treated as a promise of dry weather during a booked appointment. Keep the claim close to what the data actually describes.
Averages provide context for practical questions
For a villa search, use the climate resource to plan what to investigate. Think about covered arrival routes, outdoor seating arrangements, storage and the maintenance tasks you would want to understand. The historical table cannot establish how well an individual building handles rainfall.
During a visit, you can record visible observations and ask for relevant information about the property. Questions about drainage design, defects or building performance belong with the appropriate qualified professional. A regional chart and a building assessment serve different purposes.
Keep the station and period attached
The source is an official station record, not measurements collected at Sivana. It is presented under a 1991–2020 reference period. The publication explains that stations can have differing lengths of observation, and the Hua Hin table does not provide a completeness count for each variable. We therefore avoid describing every value as a complete set of thirty observed years.
When you share a chart, retain the station, period, units and source note. A cropped image of two bars loses much of the information needed to interpret it. Use the download from the climate resource when you want the explanation to travel with the figures.
Use a current forecast for the actual visit
Historical context helps when considering a season. A current forecast helps when preparing for a particular journey. The climate explorer is designed for the first task. For an appointment, check current conditions through a suitable weather service and confirm the practical arrangements with the team.
Open the monthly climate table, switch between rainfall and rainy days, and notice how the question changes with the unit. The full publication reference and definitions are recorded in sources and methods.